See shipment volumein the context that explains it
Measure created shipment and item volume across the period and warehouse you choose. Compare totals, daily averages, peak days, carrier and service mix, US destination states, and stores without combining the question with tracking exceptions or transit performance.
Request a demo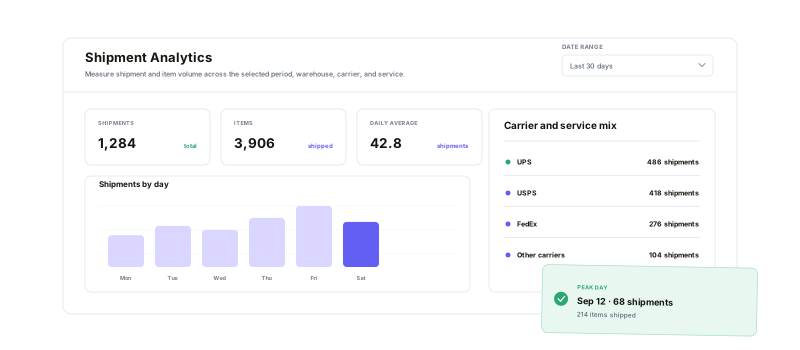
Keep the time window and warehouse consistent while changing the dimension used to understand shipment volume.
Period summary
Compare shipments, items, daily averages, and the exact peak day for each measure.
Carrier & service mix
See count and percentage by carrier or by the carrier-service combination.
Destination states
Compare shipment count across recognized US ship-to states.
Store context
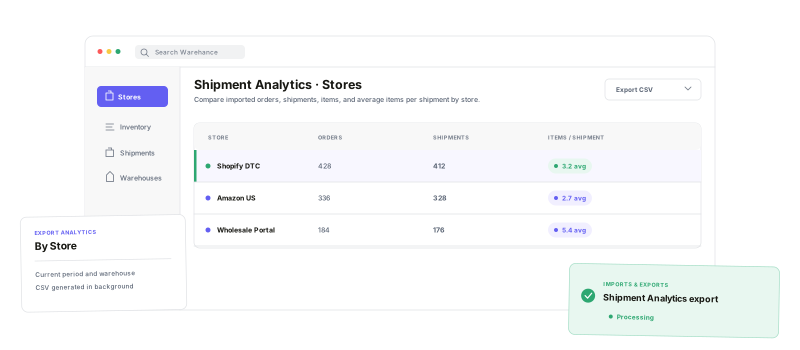
Put imported orders, shipments, items, and average items per shipment side by side.
Read volume over timethen change the breakdown
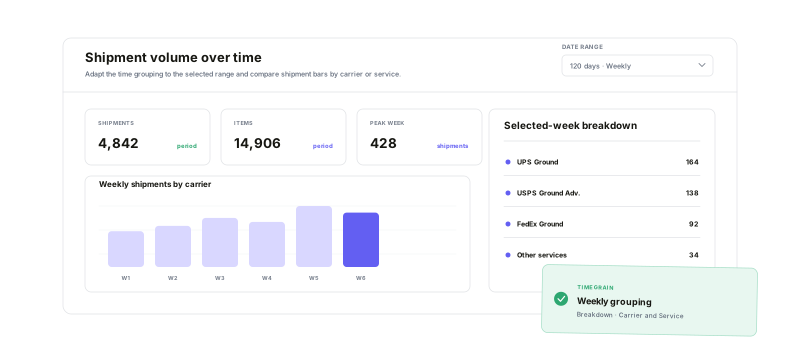
Shipment Analytics chooses day, week, or month groups from the length of the selected period. Keep a total shipment-and-item view, break shipment bars out by carrier, or add service to the carrier breakdown. Peak Day Shipments and Peak Day Items still resolve to exact dates when the visible timeline is grouped more broadly.
See where US shipments are goingone destination state at a time
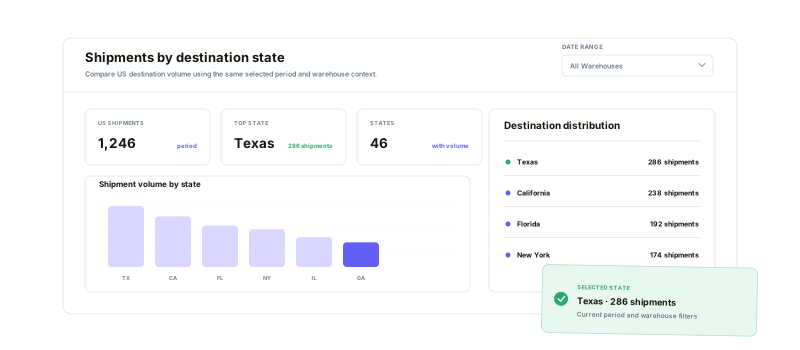
Shipments by State turns recognized US ship-to state codes into a relative-volume map for the active Period, Warehouse, and client context. Hover a state to read its shipment count. Here, State means destination geography—not shipment or tracking status.
Compare stores in the reportthen export the dataset you need
The Stores view puts imported orders beside shipment and item totals, calculates average items per shipment, and shows each store's share of volume. Export Time Series and By State data from Carriers or By Store data from Stores; Warehance processes the selected CSV files in the background and makes them available through Imports & Exports.
Shipment Analytics questions
Give shipment volume the operating context it needs
Start running your warehouse operations with Warehance today and experience complete freedom to grow your business without compromise.
